
The AI Reliability Platform
Boring production, by design.
Your system scales. Human attention does not.
Dalton joins your code, CI/CD, cloud and observability into one map. It catches failures before your alerts fire and hands you the fix to approve.
Every change moves what normal looks like.
You ship hundreds of changes a week. Your alert rules only know the normal you wrote down, and more people on call won't close that gap.
The most dangerous alert is the one you never wrote.
Dalton learns how your system really behaves, not only the rules you wrote. So the failure you never thought to alert on still reaches you, while there is time to fix it.
See how Dalton compares- cpu > 85%quiet
- p99 latency > 400 msquiet
- 5xx rate > 1%quiet
- error budget burnquiet
Other tools start at the page. Dalton starts before it.
Dalton investigates every signal and only brings you the ones that need a person. Here is a written example.
- Sees it 19 minutes early03:41: the pool starts climbing. No alert fires, because nothing has crossed a threshold yet.
- Starts the investigation03:51: it gathers five or more correlated pieces of evidence, from metrics, events, code, logs and config. Nobody is woken up to dig.
- Names the change, not the symptomNot “CPU is high.” Commit a3f2 removed the cap in getPool(n), 2 minutes before the climb.
- Hands you the fixPR #482 opens with the evidence attached. Nothing ships until you approve it. Reject it and Dalton investigates again, and remembers why.
- watching
- investigating
- cause found
- PR #482 open


One map of your system, current on every deploy.
Every deploy, config change and metric lands on the same map. That is how Dalton links a slow climb to the commit behind it, before any threshold fires.
Drag the globe to turn it. Press a workload to see what depends on it.
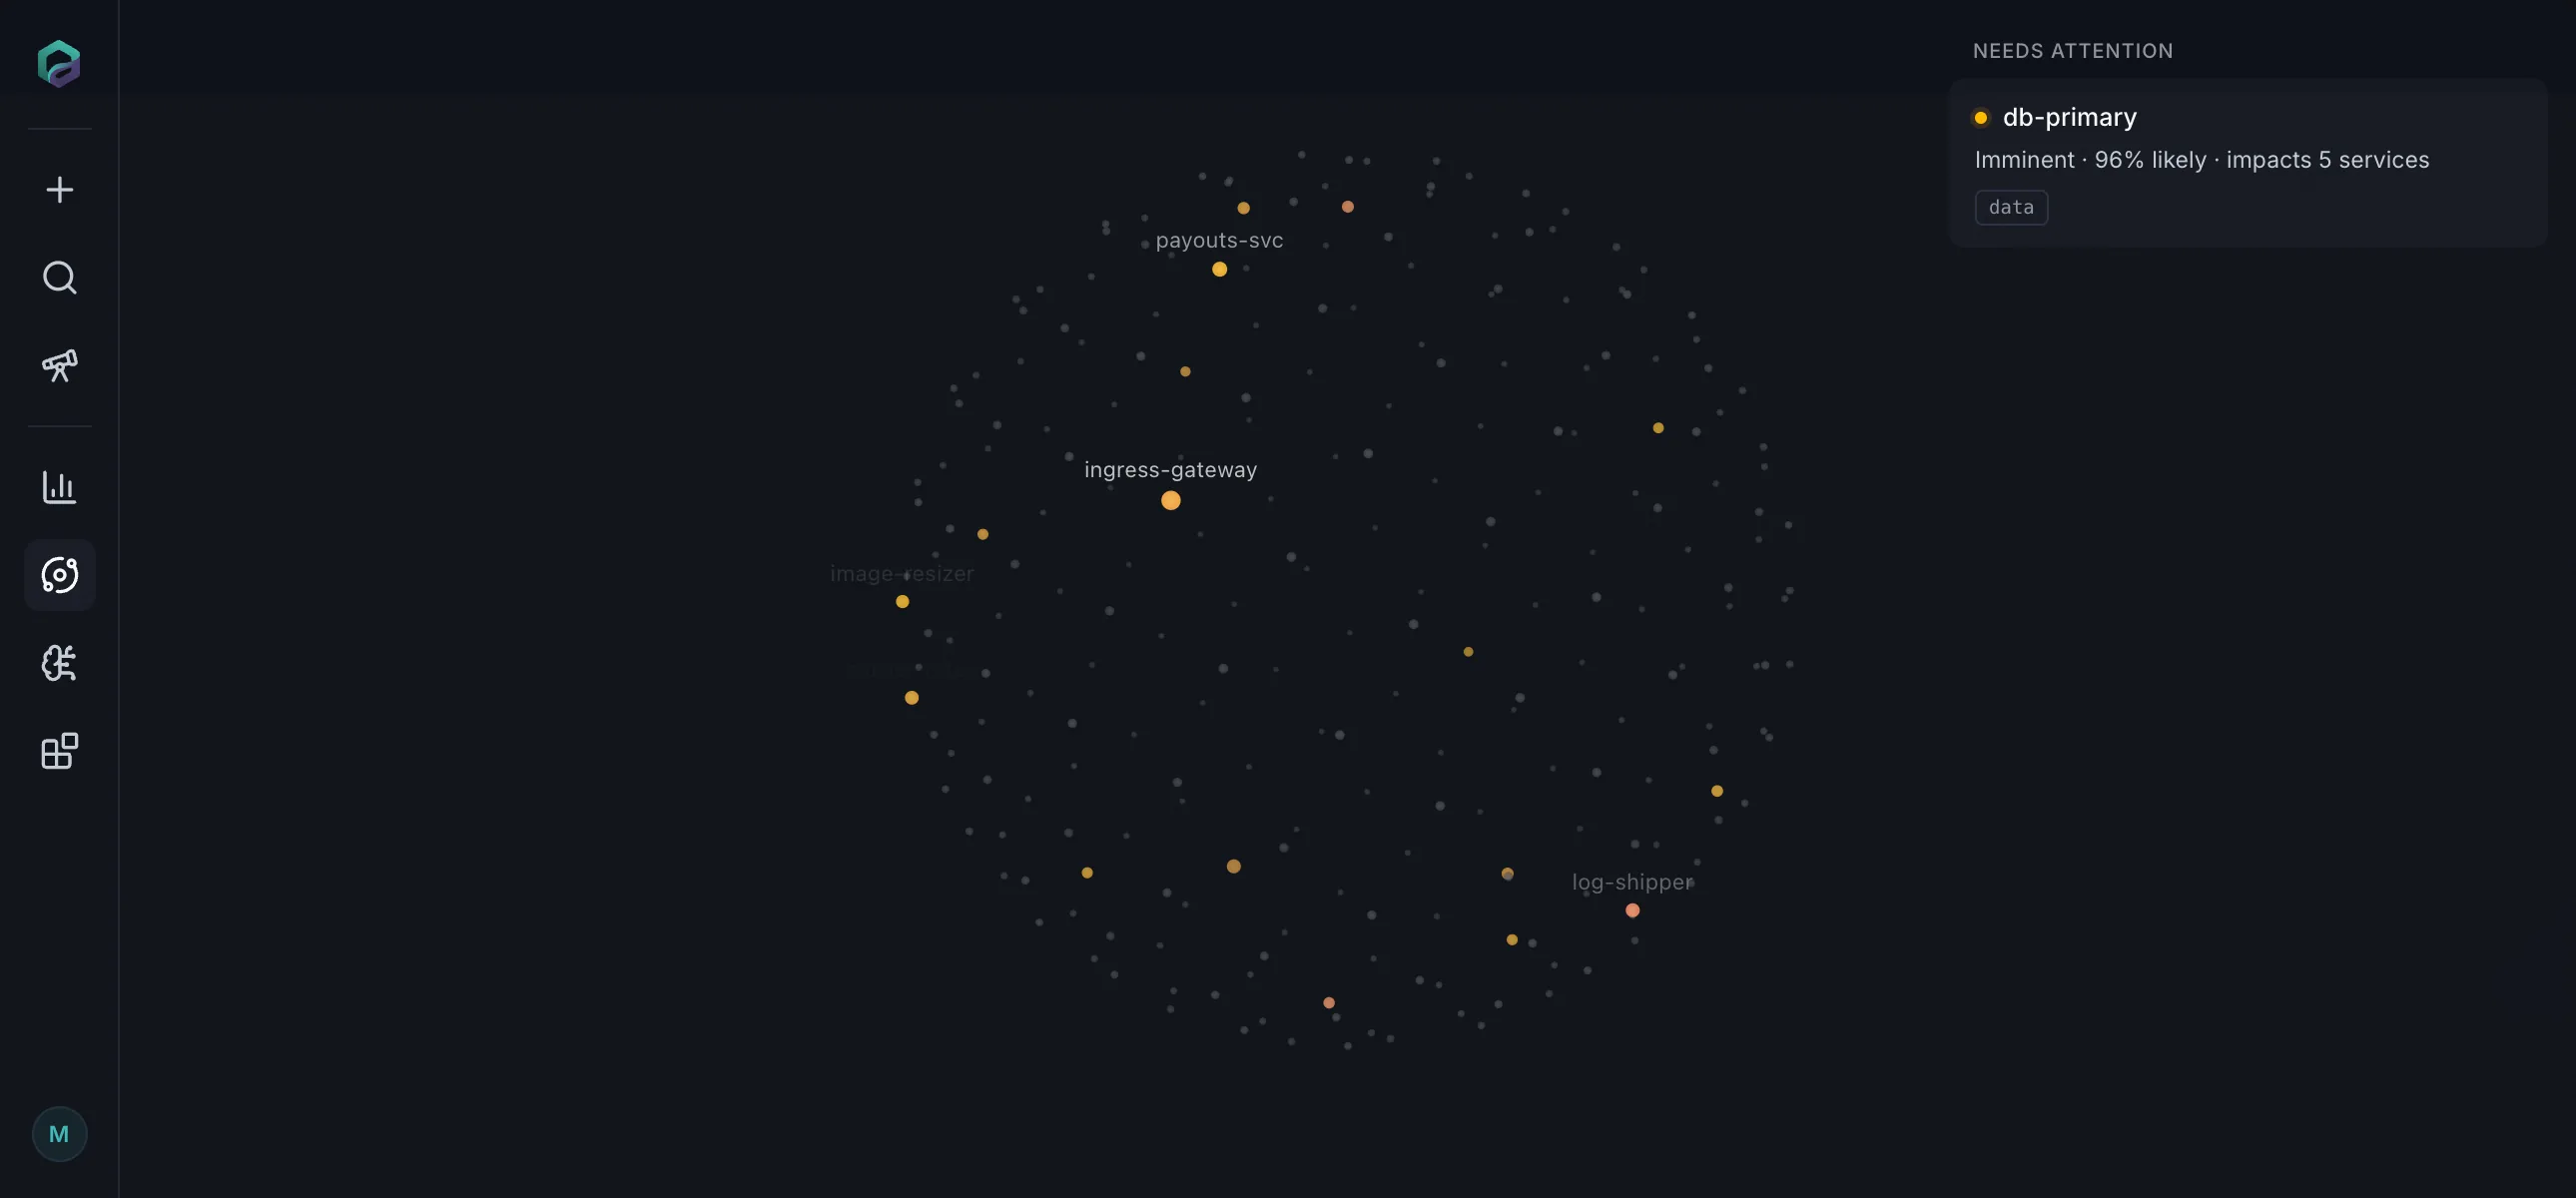
- What breaks if this fails?5 services depend on db-primary. Checkout goes first.
- Is this normal?Usually about 61 connections. Now 131, and climbing.
- What changed?Commit a3f2 removed the connection cap.
The map stays current between incidents, so an investigation never starts from zero.
See all 51 integrationsYour data stays put. Only signals and changes leave.
Dalton connects read-only. It takes signals (alerts, status changes, sharp shifts in a metric) and the changes you ship, in batches.
- Raw telemetry
- Log payloads
- Your data stores
- Signals: alerts, status changes, sharp shifts
- Kubernetes resource data
- Deploys, config changes and versions
- Read-only on every integration by default
- Every write needs a person's approval, each time. Revoke access whenever you want.
- Every read and write logged, with the credential it ran under
- Memory with an audit trail: who taught Dalton what, and when. Edit it or roll it back.
- No agents or sidecars in your services. Read-only API keys are enough; a small Kubernetes install is optional.
- Your data never trains a model, ours or anyone else's.

Dalton keeps the map, not your data. The security page lists everything that leaves.
Read the security detailsIt caught a regression our best engineers would have shipped to prod.
Head of InfrastructureAI infra
Our system kept growing and our SRE team didn't. The old model, more people for more services, just doesn't scale.
An incident used to mean a war room of six people. Now one person reads the cause and decides what to do.
Read the full case:
57 hours without Dalton. Minutes with it.What teams ask first.
We already have observability. Why do we need Dalton?
Because observability shows you what is happening, and someone still has to work out why. Dalton is an AI Reliability Platform that does that work continuously, across your code, CI/CD, cloud and observability, and brings you the cause with a fix to approve. It runs on top of your tools and replaces none of them.
How can it catch a problem before any alert fires?
By watching how your system behaves, not only the thresholds you set. Dalton tracks how every metric moves, what just changed and what depends on what, so a slow climb that starts right after a deploy gets investigated while it is still under every threshold and there is time to act.
How do we know an investigation is right?
You check its work. Every investigation arrives with five or more correlated pieces of evidence from metrics, events, code, logs and config, plus a timeline and the services affected. If it is wrong, reject it or add context: Dalton investigates again and remembers why, in a memory you can read, edit and roll back.
Will it add to our alert noise?
No. Dalton investigates first and messages you only when it has found a cause: one message per cause instead of one per symptom, sent to whoever is on call, with the evidence and the fix attached. Problems it catches early can be handled before they page anyone.
Does Dalton change production on its own?
Not by default. Dalton proposes the fix, up to a ready pull request, and you decide what ships. If you choose, you can let it apply changes directly, and turn that off at any time.
What do we have to install?
Only read-only API keys, if you prefer. Dalton connects to the tools you already run, such as Datadog, Prometheus, Grafana, AWS, GitHub, PagerDuty and Slack. On Kubernetes, you can also add one small, read-only install per cluster. Either way, there are no agents or sidecars in your services.
Will it slow our systems or raise our cloud bill?
No. Nothing of Dalton's sits in your request path, so it adds no latency. It reads in batches, so egress stays predictable, and for stores that bill per query, like BigQuery, you can limit it to the exact queries you approve.
What data leaves our network?
Only signals and changes. Signals are alerts, status changes and sharp shifts in a metric. Changes are deploys, config, versions and Kubernetes resources. Raw telemetry, log payloads and your data stores stay put. Dalton keeps the map, not your data, and never trains a model on it. Its SOC 2 Type II report is available under NDA.